
5.6.2 View CoMSIA Dialog
Function:
To display the results of a CoMSIA analysis.
License Requirements:
This feature requires a QSAR license ("QSAR").
Menubar:
MSS: QSAR >>> View QSAR >>> CoMSIA...
Dialog Description:
Figure 40 View CoMSIA Dialog
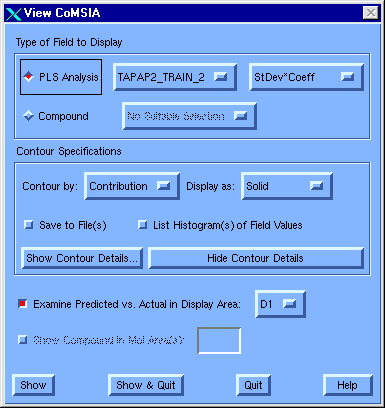
Type of Field to Display [radio button set]
- PLS Analysis select the desired analysis and field type from the adjoining option menus
- Compound select one of the compounds in the adjoining option menu. These correspond to the rows highlighted in the MSS before this dialog was invoked.
Field Type [option menu]
Select an option to control the type of CoMSIA field to be viewed.
- StDev*Coeff Uses the default, which is the standard way of viewing the output of a CoMFA analysis. It is based on the product of the SIGMA and COEFFICIENTS fields, and shows where variability in molecules' fields has explained target property differences
- Mean*Coeff QSAR multiplied by the mean of CoMFA set
- Average_Field average of fields used to derive CoMFA
- Min_Field at each point the lowest energy in CoMFA set
- Max_Field at each point the highest energy in CoMFA set
- Coefficients QSAR coefficients (if crossvalidated, the first QSAR; if bootstrapped, the mean of the QSAR)
- Discrim_Power weighs each point by its contribution to the model
- Modeling_Power weights each point by the amount of variation accounted for by the model
Contour Specifications
Contour by [option menu]
Select an option to control the interpretation of the numerical fields within this dialog.
- Contribution Uses the default, in which the dialog-box field values are interpreted as percentiles of the overall range of values within the CoMFA field being viewed.
- Actual Interprets the dialog-box values directly as CoMFA field values. If you select this option, you must change the values for the steric and electrostatic contour levels (expressed in kcal/mole).
Note: The range of a set of CoMFA StDev*Coeff field values depends strongly on the units of the dependent variable.
Display as [option menu]
Select an option to affect the appearance of the resulting display, not its content.
- Mesh Shows the contours as irregular polygons, as usually seen in CoMFA publications.
- Transparent Shows the contours as translucent surfaces.
- Solid Uses the default, in which the contours are shown as shaded opaque surfaces.
- Lines Shows the contours as irregular polygons, as usually seen in CoMFA publications (with a better definition than Mesh).
Note: Solid requires an X-driven workstation. Transparent is effective only on high-performance graphics workstations. Lines and Mesh can be displayed on any supported graphics device.
Save to File [check box]
Check this box to be prompted for the names of two permanent files for field data that you wish to plot. One file will contain the steric component. The other will contain the electrostatic component.
Note: Ordinarily, View CoMFA produces intermediate temporary files that contain the field data to be plotted.
List Histograms of Field Values [check box]
Check this box to write the distribution of actual field values to the terminal, as two histograms. Each histogram will be rotated by 90° from the way histograms usually appear. This information can be useful in selecting different contouring levels.
Show Contour Details... [push button]
Hide Contour Details [push button]
Examine Graph
Examine Predicted versus Actual in Display Area [check box and option
menu]
Check this box to include in the View CoMSIA display a graph of the predicted vs. the actual dependent-variable value (biological activity), with one point representing each compound in the CoMFA model.
Typically, the most active molecules are at the right, with the least active at the left. The better the model, the closer all the points tend toward an imaginary diagonal straight line.
Pick any of the points to bring the corresponding structure into the displayed fields.
Actual in [option menu]
Select a display area in which the predicted vs. the actual graph will be displayed. (D1 is the default.)
Note: Moving the graph away from D1 will produce an image in which the graph is directly superimposed on the fields.
Show Compound in Mol Area(s) [check box and field]
Check this box to display the selected Compound in the fields indicated in the text field (e.g., "M1,M2" or "M1 M2").
This box is active only if rows were highlighted in the MSS before the dialog was invoked and if the Compound radio button has been selected.
Additional Information:

Copyright © 1999, Tripos Inc. All rights
reserved.


