2hJNN coupling |
|||||||||||||||||||||||||
Quantitative JNN HNN-COSY experiment |
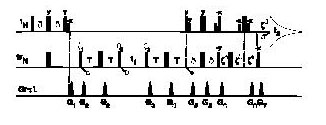
|||||||||||||||||||||||||
![]() |
|||||||||||||||||||||||||
Pulse sequence of the quantitative JNN HNN-COSY experiment. Narrow and wide pulses correspond to flip angles of 90¢X and 180¢X, respectively. RF power levels for high-power pulses are 29 ( 1H) and 5.8 kHz ( 15N). Low-power 1 H pulses are applied at a field strength of 200 Hz. Carrier positions are 1H2O ( 1H), 185 ppm ( 15N), and 153 ppm ( 13C). Garp decoupling (rB2 = 2.5 kHz) was applied during the t1 period on the 13C channel. Delays: d = 2.25 ms; T = 15 ms; z a = 2.5 ms; z b = 0.25 ms; z c = 2.25 ms; z d = 0.5 ms. Unless indicated, all pulses are applied along the x axis. Phase cycling: f1 = x, y, -x, -y; f2 = R2, -R2 with R2 =( y, -x, -y, x) ; f3 = R3, R3, -R3, -R3 with R3 = -y, x, y, -x); Acq. = x, -y, -x, y. Quadrature detection in the t1 dimension was achieved by simultaneously incre-menting f1 and f2 in the States-TPPI manner. Gradients are sine-bell shaped, with an absolute amplitude of 25 G/cm at their center and durations (polarities) of G1,2,3,4,5,6,7 = 2.5 (+), 2.1 (-), 1.35 (+), 2.35 (+), 0.2 (+), 0.4 (+), and 0.101 ms (+). | |||||||||||||||||||||||||
¡@ |
|||||||||||||||||||||||||
Quantitative
JNN HNN-COSY spectrum
|
|||||||||||||||||||||||||
![]() |
|||||||||||||||||||||||||
Quantitative JNN
HNN-COSY spectrum of the uniformly 13C/15 N-labeled intramolecular DNA
triplex. Positive contours depict diagonal resonances, and negative contours
(dashed lines) correspond to cross-peaks resulting from scalar 15N-
15N magnetization transfer. Resonances are labeled with assignment information.
The insert in the bottom panel illustrates the definition of the trans-hydrogen-bond
2hJNN correlation. Resonances marked with an asterisk
are a result of a second minor conformation of the DNA triplex. |
|||||||||||||||||||||||||
|
|||||||||||||||||||||||||
Ic/Id = tan 2 (2pJNNT) | |||||||||||||||||||||||||
Result |
|||||||||||||||||||||||||
|
|||||||||||||||||||||||||
|
|||||||||||||||||||||||||
Compare the 2hJNN with RN...N |
|||||||||||||||||||||||||
|
|||||||||||||||||||||||||
* The distances data come from X-ray crystallography ( PDB : 1AAY, 1A1l, 1AZP ; NDB : BD0007, BDJ019, BDl084, AR0009) | |||||||||||||||||||||||||
The result means : an increased overlap between the 1s atomic orbital of the imino proton and a trigonal hybrid orbital of nitrogen acceptor atom lead to a decrease in RN...N distance and an increase in the 2hJNN. |