|
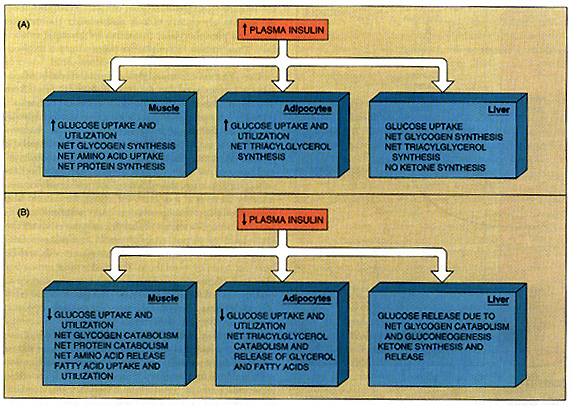
| Figure 1 : Summary of overall target-cell responses cell response to an increase (A) or (B)decrease in the plasma concentration of insulin. The biochemical events that underlie these responses are given in Figure 2.
|
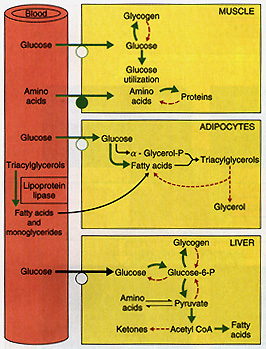 | Figure 2 : Key biochemical events that underlie the responses of target cells to insulin summarized in Figure 1. Each green arrow denotes a process stimulated by insulin, whereas a dashed red arrow denotes inhibition by insulin, All these effects, except for those exerted on the transport of glucose and amino acids, are mediated by insulin-dependent enzyme. The bowed arrows denote pathways whose reversibility is mediated by different enzyme.
|
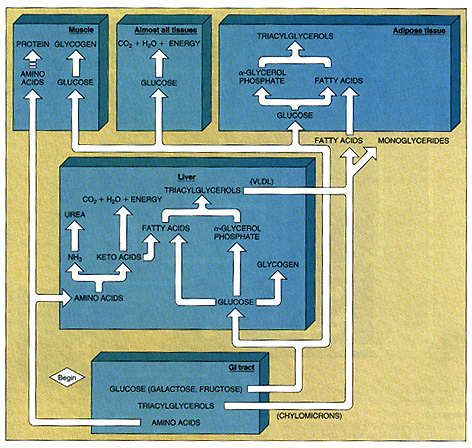
 | Figure 3 : Major metabolic pathway of the absorptive state. The monoglycerides formed by the action of lipoprotein lipase in the adipose-tissue capillaries are not taken up by the adipose-tissue cell but circulate to the liver for further metabolism. The arrow from amino acids to protein in muscles is dashed to denote the fact excess amino acids are not stored as protein. Urea, formed in the liver, enters the blood and is excreted by the kidneys. All arrows between boxes denote carriage of the substance via the blood. VLDL = very low density lipoprotein.
|
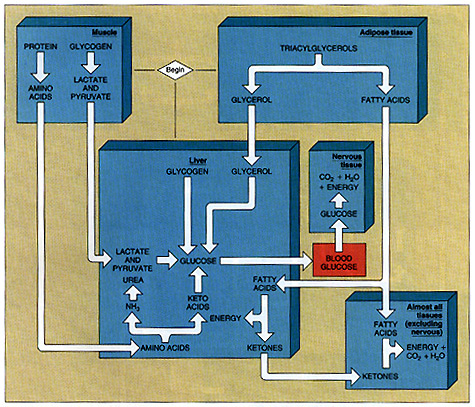
 | Figure 4 : Major metabolic pathways of the postabsorptive state. The central is regulation of the blood glucose concentration. All arrows between boxes denote carriages of the substance via the blood. Urea, formed in the liver, enter the blood and is excreted by the kidneys.
|
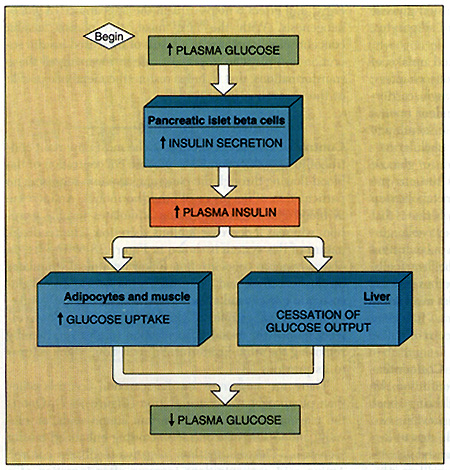 | Figure 5 : Negative-feedback nature of plasma glucose control over insulin secretion.
|
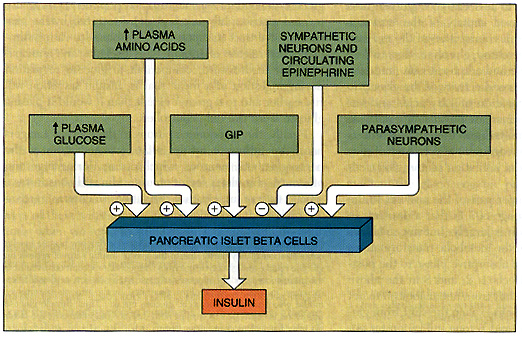 | Figure 6 : Major control of insulin secretion. GIP = glucose-dependent insulinotropic peptide, a gastrointestinal hormone.
|